IntersectionalityScore.com

IntersectionalityScore.com · 2018 to 2026

A million people ranked their oppression.

For eight years, people moved thirteen sliders, mostly for things they were born with, and got a single number for how “oppressed” they are. About a million people did it. Here’s what their scores showed.

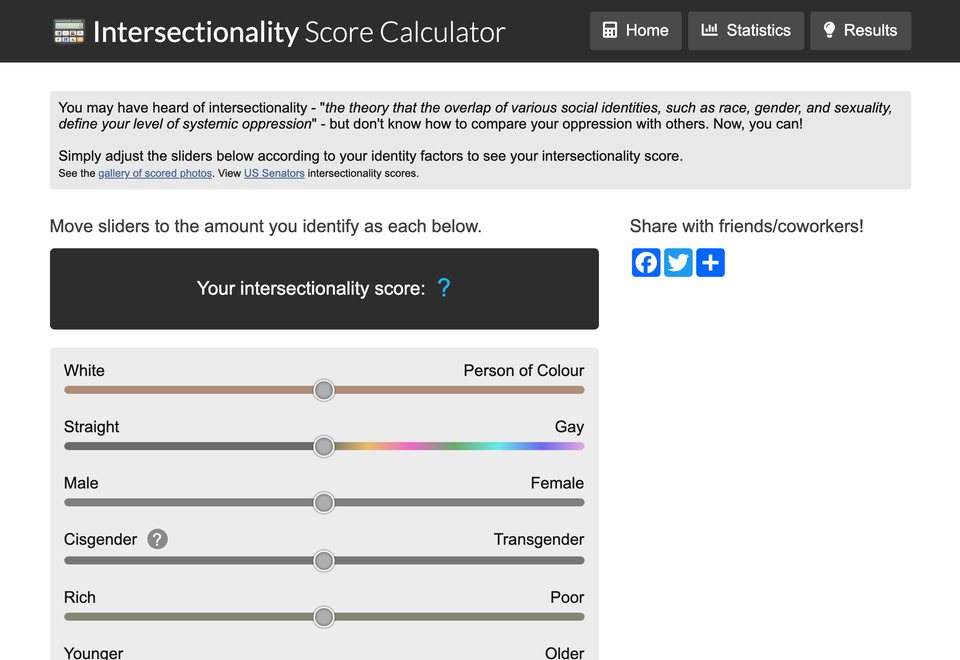
The IntersectionalityScore.com calculator: thirteen colored sliders under a dark score box
The calculator. Still live. Click to play it.
1,078,102scores, November 2018 to May 2026
987,760different browsers that got one: about a million people
1,441,570visits in all

Every score

Drag to any score

See how many people got it, a few of the very different people who did, and how they felt afterward. 0 is “most privileged,” 100 “most oppressed.”

27

“How do you feel about intersectionality now?”

The survey question after the score. Answers from people who scored within 5 points of this one.

Some of the people who got it

Same score, different lives. 76% of all scores came from a combination of sliders no one else entered. The people shown are real combinations, each entered on at least three visits, picked to be as different as possible, and each one checked against the site’s formula.

What the data showed

Four things eight years showed

Insight 1 of 4

Most minds didn’t move. The ones that did mostly moved away.

After the score, a short survey asked: How do you feel about "Intersectionality" now? About half said “About the same.” Of the rest, about three moved away from intersectionality for every one who moved toward it.

It was much the same across the political spectrum, with one exception: people on the left came out about even. And it softened over the years: in 2019, 34% came away less favorable; by 2025–26, 17%.

Open for more

13,606 people answered. 54% said “About the same,” 34% “Less favorable” and 12% “More favorable.” “Less favorable”: conservatives 57%, moderates 33%, left/liberal 15% (and 19% “More favorable”). These leave out the max-outs described in insight 3.

The 25 states with at least 50 answers ranged from about a quarter to under half “Less favorable,” and none differed from the rest of the country by more than chance would explain. A few countries did differ (Mexico warmer, Sweden and Norway cooler), but with few answers and no clear reason, so the map of states and countries is gone.

The survey was optional and about 1 in 100 visits answered it.

How they felt afterward

The question, word for word: How do you feel about "Intersectionality" now? Less favorable · About the same · More favorable

  • Less favorable
  • About the same
  • More favorable

Insight 2 of 4

Being called privileged put people off. At the very top, people were mostly playing.

This is how people felt after the test, grouped by the score it had just given them. A low score meant the calculator called you privileged; a high one, oppressed.

The low end. People told they were among the most privileged were the most put off: 51% came away less favorable. That held in every political group. Even on the left, 32% of the low scorers came away less favorable, against 10% in the middle.

The top end. You couldn’t reach 100 without claiming to be a devout Muslim and a devout Jew at once, and all but one of the 28,590 hundreds did. Of the people who scored 80 or more and answered, 82% had pushed every slider to the far right or picked two faiths. Leave them out and too few remain to say much.

The real story is politics. 57% of conservatives came away less favorable, against 15% on the left. The score mattered on top of that.

Open for more

After politics, the factor that split people most was the sex slider: 45% at the Male end came away less favorable, against 17% at the Female end.

The most common score, 12, is exactly what you got with every slider at its left end and no religion. 2.7% hit 100, nearly all by stacking every slider to the right. On 12 visits, someone edited the request by hand to send a score like 420, 666, 9,000 or 2,147,483,647, the biggest number the database could hold.

How they felt afterward, by the score they got

The question, word for word: How do you feel about "Intersectionality" now? Less favorable · About the same · More favorable

  • Less favorable
  • About the same
  • More favorable

Insight 3 of 4

Faith was the touchiest part.

Andrew

The Muslim, Christian and Jewish sliders were the most conflicted, because each side has someone who feels negative about the other’s religion. My understanding of what’s between Muslims, Christians and Jewish people is much more nuanced now.

Insight 4 of 4

Give people a blank slider and they'll tell you who they are. And about Shrek.

What the site said, word for word: “However, we realize that there are many other factors that could be included to refine the calculation. You can suggest other sliders below and vote on ones you think are useful.”

So visitors could add a fourteenth slider, with a label at each end, and others could like it and say where they sat on it. They suggested 1,166. The most liked was serious: Neurotypical to Neurodivergent (506 likes). The runner-up was not: Doesn’t believe in Shrek to Believes in Shrek (458 likes).

That was the joke working. Once you start counting identities there’s no natural place to stop, so people kept going: cereal or milk first, pineapple on pizza, left-handed, can find New Zealand on a map.

Suggested by visitors, most in 2019. The dot is where the people who voted on each one placed themselves, on average. A few rude ones are left out.

Why I built it

I understand how it could feel if somebody tells you you’re being attacked, oppressed or maligned for every dimension of who you are. I can understand how that can make someone feel very threatened.

I’d hoped to thread the needle. On one level it can feel true. On another, when we started this, it felt like intersectionality could be misused, because its starting assumption, that people are held back by each of these things, was never really challenged. I wanted to get that discussion going. I’m a math guy, so I built a calculator that adds them up. It was a simple calculator, not my PhD.

Looking back, I was biased. I’ve always been biased against movements that get used as a hammer against somebody. Today I’m a more understanding person, and I’m still trying to figure out how to bring people together.

I support initiatives to help certain communities. The only question is to what extent, and that’s for others more than me to decide. There are pros and cons, as there are for almost every position.

Eight years later, the data gives us perspective to ask whether we still think this way.

When the word came around

How often “intersectionality” appeared in books, and how often people searched for it. Each line is scaled to its own peak.

  • In books (Google Books Ngram)
  • In web searches (Google Trends)
Use took off in the mid-2010s and kept climbing; the calculator arrived in the middle of the climb. Sources: Google Books Ngram Viewer, English, 2000 to 2022; Google Trends, worldwide web searches, yearly averages, 2008 to 2026 (2026 is January to October). Both fetched October 24, 2026.
Open for more: the jokes, in the site's own words

How can they be used?"You can use it when you're dealing with others to know who's more marginalized instead of getting to know them as individuals."

How can I improve my score?"Unfortunately, you are born with most of your intersectional factors. ... You may award yourself up to 5 points depending on the level of your activism."

What about peanut allergies?"We know that 100s of other factors such political affiliation, height, attractiveness, weight and even peanut allergies can impact your personal intersectionality score. Hopefully, we will be able to address these factors in the future."

And in politics?"For example, someone with an intersectional score of 60 would get twice as many votes as someone with a score of 30."

The FAQ as the Internet Archive captured it, December 1, 2018 and October 12, 2026.

The case for it

What intersectionality says, in its own terms

The idea grew out of a 1976 lawsuit. Five Black women sued General Motors: the company hadn’t hired Black women before 1964, and when layoffs came, the Black women it had hired since were the first to go. The court would look at race or at sex, but not at both together. GM had hired women, white women, so the court saw no sex discrimination, and it sent the race claim off to a different case. In 1989 the law professor Kimberlé Crenshaw used the case to show how people can fall through the gap between two categories. She called the idea intersectionality.

In its own terms, privilege doesn’t mean your life is easy. It means some things that are hard for other people never come up for you, often without your noticing, because they’re normal to you. Oppression isn’t mainly about mean people. It’s about rules, habits and institutions that leave some groups worse off, whatever anyone intends.

At its best, it asks for something most people would agree with: look at the whole person and the whole situation before you decide what’s fair. Its defenders would also say a calculator like this one gets it wrong. Intersectionality isn’t about adding up points; it’s about noticing how things combine.

And its limits

Groups are averages, and no one is an average. A rich person of color and a poor white person don’t fit the story the categories tell. Used as a ranking, it can turn people into scores and conversations into contests over who has it worse. And when every difference is about power, it’s harder to see what people share. Those limits are what the calculator was built to show, by doing the math out loud.

How the formula worked

The weights were mine, and they were arbitrary.

Each slider had a weight, and the score was a weighted average. I had to pick something, so I picked the things that were in the news, where people on both sides felt real tension, and I gave race the most. The Black Lives Matter protests of 2020 came soon after.

Because race carried the most weight, the race slider explained 67% of the differences between people’s scores. That’s a fact about my formula, not about people.

The note I left in the code for anyone who peeked. It went in during the first week of December 2018 and is still there:

// Hello JS reader! As you can see, the current formula for Intersectionality Scores is sort of a weighted average
// of the sliders plus a little extra if you have no religion.  In the future, we plan to let people define their
// own weights to the factors as we've found that most people want to tweak the weights according to whatever
// factor they have that's the most oppressed.  But until then, well, this is the officially sanctioned weights
// so there will be more arguments.  Thanks for visiting and spread the word.  Hopefully, we can stamp out all
// forms of bias worldwide.  Peace and love!

Looking back, we probably should have let people set their own weights. The note even promised it.

Open for more: is this really the code I wrote?

Yes. This is the scoring code from the site itself, copied from the Internet Archive's copies of December 1, 2018 and October 12, 2026. The weights never changed. Run on 200,000 of the saved scores, it reproduces 99.9% of them exactly.

racen = 220; // weight
orientn = 80;  sexn = 120;  gendern = 60;  rpn = 40;
abilityn = 50; agen = 30;  christiann = 30; muslimn = 50;
jewishn = 20;  nativen = 50; englishn = 20; educationn = 30

//score = (racen - race.value) * (orientn - orient.value) * (sexn - sex.value) / (racen * orientn * sexn);
score = racen * (race.value) / 100 + orientn * (orient.value) / 100 + sexn * (sex.value) / 100
      + gendern * (gender.value) / 100 + rpn * (richpoor.value) / 100 + abilityn * (ability.value) / 100
      + agen * (0.5 + Math.abs(50 - age.value) / 100) + christiann * (100 - christian.value) / 100
      + muslimn * (muslim.value) / 100 + jewishn * (jewish.value) / 100 + nativen * (native.value) / 100
      + englishn * (english.value) / 100 + educationn * (education.value) / 100;
score = score / (racen + orientn + sexn + gendern + rpn + abilityn + agen + ... );   // = 800
// having no religion has some oppression
if (christian.value + muslim.value + jewish.value < 30) { score += .05 * ...; }

Three things the code shows. The first attempt is still there, commented out: a formula that multiplied sliders instead of adding them. Age counts at both ends, so being very young or very old raised the score. And the "no religion" bonus added the three faith sliders as text rather than numbers, so as a rule it only kicked in when the Christian and Muslim sliders sat at zero. Visitors noticed the weights within days, and a few read the code too.

How much each slider counted

Share of the score’s total weight, from the site’s own code

Sorting people by immutable characteristics is a terrible way to sort people.

"I have a dream that my four little children will one day live in a nation where they will not be judged by the color of their skin but by the content of their character."

Martin Luther King Jr., August 28, 1963
Notes and sources
  1. Data. The site’s own tables, extracted May 10, 2026 (November 26, 2018 to May 8, 2026). Totals and shares only. A “completed calculation” is a visit with all thirteen sliders set and a score shown. Visits on someone’s shared result are left out of score figures.
  2. Scripts. Every number is filled in by 12_render_page.py from scripts 01 to 22.
  3. Max-outs. A visit where every slider except the faiths sat at its far “oppressed” end, or where two or more faiths were set to devout at once. Left out where the text says so.
  4. States. Each state with 50 or more survey answers was compared with the rest of the country, allowing for the number of comparisons. None differed by more than chance.
  5. The word. Google Books Ngram Viewer (English, 2000 to 2022, no smoothing) and Google Trends (worldwide web searches, monthly, averaged by year), fetched October 24, 2026.
  6. The vote. Three optional questions after the score, word for word the same from June 2019 to October 2026. 14,037 answers; 13,606 to How do you feel about "Intersectionality" now? Self-described, after a provocative page: a window on who answered, not a poll of the public.
  7. Scores. The explorer counts only scores the site’s formula can produce: 1,836 saved scores (0.17%) didn’t match it (edited requests or early code) and are left out. The formula can’t go below 1, because age always adds a little, so no one scored exactly 0.
  8. People. 1,078,102 completed scores came from 987,760 different browser sessions, so “about a million people”: one person on two devices counts twice, and a return visit in the same browser counts once.
  9. Quotations. King, 1963: Martin Luther King, Jr. Research and Education Institute, Stanford. The site's FAQ and code: Internet Archive captures.